Drawing MorseLink Presentations: Difference between revisions
From Knot Atlas
Jump to navigationJump to search
No edit summary |
No edit summary |
||
| Line 1: | Line 1: | ||
KnotTheory` can also draw knots and links via their [[MorseLink Presentations|Morse link presentations]]: |
KnotTheory` can also draw knots and links via their [[MorseLink Presentations|Morse link presentations]]: |
||
{{Startup Note}} |
|||
<!--$$?DrawMorseLink$$--> |
<!--$$?DrawMorseLink$$--> |
||
<!--Robot Land, no human edits to "END"--> |
<!--Robot Land, no human edits to "END"--> |
||
Revision as of 12:17, 6 September 2005
KnotTheory` can also draw knots and links via their Morse link presentations:
(For In[1] see Setup)
|
| ||||||||
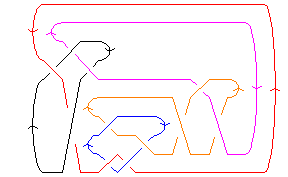
For example, here is the 11-crossing alternating link L11a548:
In[4]:=
|
Show[DrawMorseLink[Link[11, Alternating, 548]]]
|

| |
Out[4]=
|
-Graphics-
|
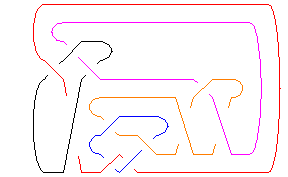
There are two options available for this program. Adding the option Gap -> g, where g is between 0 and 1, changes the amount of white space in each crossing; increasing g increases the white space, making large diagrams more visible. The option ArrowSize -> as (where as is between 0 and 1) alters the size of the orientation arrows. Here is the same drawing as above, but this time the orientation arrows are gone and the crossings are more clear:
In[6]:=
|
Show[DrawMorseLink[Link[11, Alternating, 548], ArrowSize -> 0, Gap -> 0.65]]
|

| |
Out[6]=
|
-Graphics-
|