Drawing Planar Diagrams: Difference between revisions
No edit summary |
DrorsRobot (talk | contribs) No edit summary |
||
| Line 43: | Line 43: | ||
<!--$$Show[DrawPD[MillettUnknot, {Gap -> 0.03}]]$$--> |
<!--$$Show[DrawPD[MillettUnknot, {Gap -> 0.03}]]$$--> |
||
<!--The lines to END were generated by WikiSplice: do not edit; see manual.--> |
<!--The lines to END were generated by WikiSplice: do not edit; see manual.--> |
||
{{Graphics1|n= |
{{Graphics1|n=7}} |
||
Show[DrawPD[MillettUnknot]] |
Show[DrawPD[MillettUnknot, {Gap -> 0.03}]] |
||
{{Graphics2|n= |
{{Graphics2|n=7|imagename=Drawing_Planar_Diagrams_Out_7.gif}} |
||
<!--END--> |
<!--END--> |
||
Revision as of 15:33, 24 August 2005
My summer student Emily Redelmeier is in the process of writing a program that uses circle packing to draw an arbitrary object given as a PD as in Planar Diagrams. At the moment her program is still slow, limited and sometimes buggy, but it is already quite useful, as the following lines show:
(For In[1] see Setup)
In[2]:= ?DrawPD
DrawPD[pd] takes the planar diagram description pd and creates a graphics object containing a picture of the knot. DrawPD[pd,options], where options is a list of rules, allows the user to control some of the parameters. OuterFace->n sets the face at infinity to the face numbered n. OuterFace->{e_1,e_2,...,e_n} sets the face at infinity to a face which has edges e_1, e_2, ..., e_n in the planar diagram description. Gap->g sets the size of the gap around a crossing to length g. |
In[3]:= DrawPD::about
DrawPD was written by Emily Redelmeier at the University of Toronto in the summers of 2003 and 2004. |
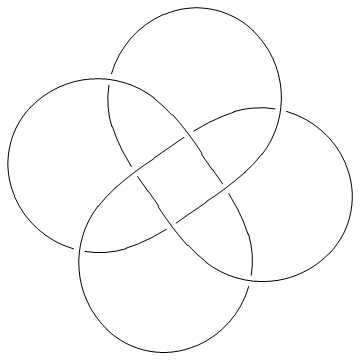
Thus, for example, here's the torus knot T(4,3):
| In[4]:= |
Show[DrawPD[TorusKnot[4, 3]]] |

| |
| Out[4]= | -Graphics- |
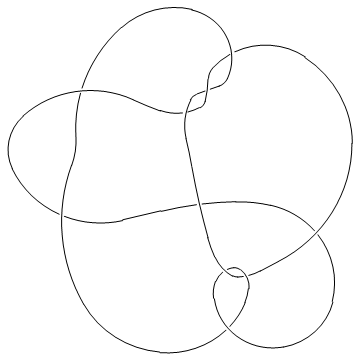
One problem we currently have is that crossings come out at non-uniform sizes, hence in the picture below you may need magnifying glasses to decide who's over and who's under:
| In[5]:= |
MillettUnknot = PD[X[1,10,2,11], X[9,2,10,3], X[3,7,4,6], X[15,5,16,4], X[5,17,6,16],X[7,14,8,15], X[8,18,9,17], X[11,18,12,19], X[19,12,20,13], X[13,20,14,1]]; |
| In[6]:= |
Show[DrawPD[MillettUnknot]] |

| |
| Out[6]= | -Graphics- |
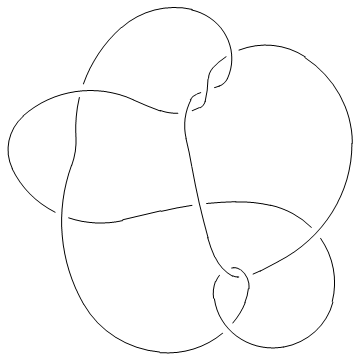
In such a situation, the option Gap is sometimes handy:
| In[7]:= |
Show[DrawPD[MillettUnknot, {Gap -> 0.03}]] |

| |
| Out[7]= | -Graphics- |