Drawing Braids
From Knot Atlas
Jump to navigationJump to search
(For In[1] see Setup)
| ||||
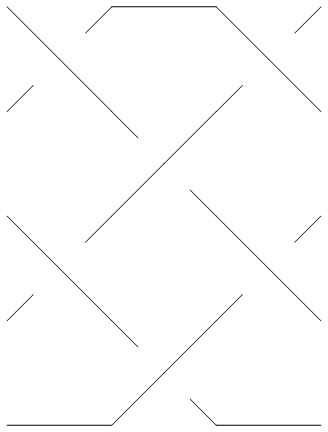
Thus for example,
In[2]:=
|
br = BR[5, {{1,3}, {-2,-4}, {1, 3}}];
|
In[4]:=
|
Show[BraidPlot[br]]
|

| |
Out[4]=
|
-Graphics-
|
BraidPlot takes several options:
In[5]:=
|
Options[BraidPlot]
|
Out[5]=
|
{Mode -> Graphics, Images -> {0.gif, 1.gif, 2.gif, 3.gif, 4.gif},

  HTMLOpts -> }
|
The Mode option to BraidPlot defaults to "Graphics", which produces output as above. An alternative is setting Mode -> "HTML", which produces an HTML