Drawing Braids: Difference between revisions
From Knot Atlas
Jump to navigationJump to search
DrorsRobot (talk | contribs) No edit summary |
No edit summary |
||
| Line 41: | Line 41: | ||
<!--END--> |
<!--END--> |
||
The <code>Mode</code> option to <code>BraidPlot</code> defaults to "<code>Graphics</code>", which produces output as above. An alternative is setting <code>Mode -> "HTML"</code>, which produces an HTML <tt> |
The <code>Mode</code> option to <code>BraidPlot</code> defaults to "<code>Graphics</code>", which produces output as above. An alternative is setting <code>Mode -> "HTML"</code>, which produces an HTML <tt> |
||
<!--$$BraidPlot[br, Mode -> "HTML"]$$--> |
|||
<!--Robot Land, no human edits to "END"--> |
|||
{{InOut| |
|||
n = 6 | |
|||
in = <nowiki>BraidPlot[br, Mode -> "HTML"]</nowiki> | |
|||
out= <nowiki><table cellspacing=0 cellpadding=0 border=0> |
|||
<tr><td><img src=1.gif><img src=0.gif><img src=1.gif></td></tr> |
|||
<tr><td><img src=2.gif><img src=3.gif><img src=2.gif></td></tr> |
|||
<tr><td><img src=1.gif><img src=4.gif><img src=1.gif></td></tr> |
|||
<tr><td><img src=2.gif><img src=3.gif><img src=2.gif></td></tr> |
|||
<tr><td><img src=0.gif><img src=4.gif><img src=0.gif></td></tr> |
|||
</table></nowiki>}} |
|||
<!--END--> |
|||
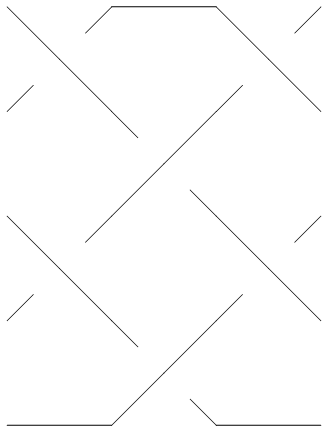
The table produced contains an array of image inclusions that together draws the braid using 5 fundamental building blocks: a horizontal "unbraided" line (<tt>0.gif</tt> above), the upper and lower halves of an overcrossing (<tt>1.gif</tt> and <tt>2.gif</tt> above) and the upper and lower halves of an underfcrossing (<tt>3.gif</tt> and <tt>4.gif</tt> above). |
|||
Assuming <tt>0.gif</tt> through <tt>4.gif</tt> are [[Image:BraidPart0.gif]], [[Image:BraidPart1.gif]], [[Image:BraidPart2.gif]], [[Image:BraidPart3.gif]] and [[Image:BraidPart4.gif]], the above table is rendered as follows: |
|||
{| cellspacing=0 cellpadding=0 border=0 align=center |
|||
|[[Image:BraidPart1.gif]][[Image:BraidPart0.gif]][[Image:BraidPart1.gif]] |
|||
|- |
|||
|[[Image:BraidPart2.gif]][[Image:BraidPart3.gif]][[Image:BraidPart2.gif]] |
|||
|- |
|||
|[[Image:BraidPart1.gif]][[Image:BraidPart4.gif]][[Image:BraidPart1.gif]] |
|||
|- |
|||
|[[Image:BraidPart2.gif]][[Image:BraidPart3.gif]][[Image:BraidPart2.gif]] |
|||
|- |
|||
|[[Image:BraidPart0.gif]][[Image:BraidPart4.gif]][[Image:BraidPart0.gif]] |
|||
|} |
|||
The meaning of the <code>Images</code> option to <code>BraidPlot</code> should be clear from reading its default definition: |
|||
<!--$$Images /. Options[BraidPlot]$$--> |
|||
<!--Robot Land, no human edits to "END"--> |
|||
{{InOut| |
|||
n = 7 | |
|||
in = <nowiki>Images /. Options[BraidPlot]</nowiki> | |
|||
out= <nowiki>{0.gif, 1.gif, 2.gif, 3.gif, 4.gif}</nowiki>}} |
|||
<!--END--> |
|||
The <code>HTMLOpts</code> option to <code>BraidPlot</code> allows to insert options within the HTML <tt><img></tt> tags. Thus |
|||
<!--$$BraidPlot[BR[2, {1, 1}], Mode -> "HTML", HTMLOpts -> "border=1"]$$--> |
|||
<!--Robot Land, no human edits to "END"--> |
|||
{{InOut| |
|||
n = 8 | |
|||
in = <nowiki>BraidPlot[BR[2, {1, 1}], Mode -> "HTML", HTMLOpts -> "border=1"]</nowiki> | |
|||
out= <nowiki><table cellspacing=0 cellpadding=0 border=0> |
|||
<tr><td><img border=1 src=1.gif><img border=1 src=1.gif></td></tr> |
|||
<tr><td><img border=1 src=2.gif><img border=1 src=2.gif></td></tr> |
|||
</table></nowiki>}} |
|||
<!--END--> |
|||
The above table is rendered as follows: |
|||
<center>[[Image:BraidPlotHTMLExample2.gif]]</center> |
|||
<!--$$?CollapseBraid$$--> |
|||
<!--Robot Land, no human edits to "END"--> |
|||
{{HelpLine| |
|||
n = 9 | |
|||
in = <nowiki>CollapseBraid</nowiki> | |
|||
out= <nowiki>CollapseBraid[br] groups together commuting generators in the braid br. Useful in conjunction with BraidPlot to produce compact braid plots.</nowiki>}} |
|||
<!--END--> |
|||
Thus compare the plots of <code>br1</code> and <code>br2</code> below: |
|||
<!--$$br1 = BR[TorusKnot[5, 4]]$$--> |
|||
<!--Robot Land, no human edits to "END"--> |
|||
{{InOut| |
|||
n = 10 | |
|||
in = <nowiki>br1 = BR[TorusKnot[5, 4]]</nowiki> | |
|||
out= <nowiki>BR[4, {1, 2, 3, 1, 2, 3, 1, 2, 3, 1, 2, 3, 1, 2, 3}]</nowiki>}} |
|||
<!--END--> |
|||
<!--$$Show[BraidPlot[br1]]$$--> |
|||
<!--Robot Land, no human edits to "END"--> |
|||
{{Graphics| |
|||
n = 12 | |
|||
in = <nowiki>Show[BraidPlot[br1]]</nowiki> | |
|||
img= Drawing_Braids_Out_11.gif | |
|||
out= <nowiki>-Graphics-</nowiki>}} |
|||
<!--END--> |
|||
<!--$$br2 = CollapseBraid[BR[TorusKnot[5, 4]]]$$--> |
|||
<!--Robot Land, no human edits to "END"--> |
|||
{{InOut| |
|||
n = 13 | |
|||
in = <nowiki>br2 = CollapseBraid[BR[TorusKnot[5, 4]]]</nowiki> | |
|||
out= <nowiki>BR[4, {{1}, {2}, {3, 1}, {2}, {3, 1}, {2}, {3, 1}, {2}, {3, 1}, {2}, |
|||
{3}}]</nowiki>}} |
|||
<!--END--> |
|||
<!--$$Show[BraidPlot[br2]]$$--> |
|||
<!--Robot Land, no human edits to "END"--> |
|||
{{Graphics| |
|||
n = 15 | |
|||
in = <nowiki>Show[BraidPlot[br2]]</nowiki> | |
|||
img= Drawing_Braids_Out_14.gif | |
|||
out= <nowiki>-Graphics-</nowiki>}} |
|||
<!--END--> |
|||
Revision as of 08:32, 19 June 2007
(For In[1] see Setup)
| ||||
Thus for example,
In[2]:=
|
br = BR[5, {{1,3}, {-2,-4}, {1, 3}}];
|
In[4]:=
|
Show[BraidPlot[br]]
|

| |
Out[4]=
|
-Graphics-
|
BraidPlot takes several options:
In[5]:=
|
Options[BraidPlot]
|
Out[5]=
|
{Mode -> Graphics, Images -> {0.gif, 1.gif, 2.gif, 3.gif, 4.gif},

  HTMLOpts -> }
|
The Mode option to BraidPlot defaults to "Graphics", which produces output as above. An alternative is setting Mode -> "HTML", which produces an HTML