Drawing Braids
(For In[1] see Setup)
In[2]:= ?BraidPlot
BraidPlot[br, opts] produces a plot of the braid br. Possible options are Mode, HTMLOpts and Images. |
Thus for example,
| In[3]:= |
br = BR[5, {{1,3}, {-2,-4}, {1, 3}}]; |
| In[4]:= |
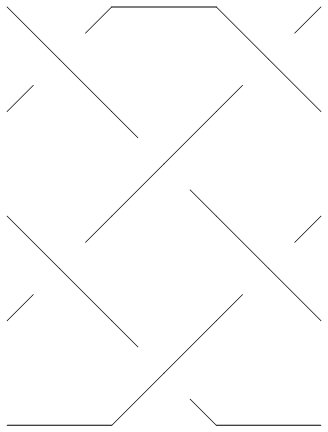
Show[BraidPlot[br]] |

| |
| Out[4]= | -Graphics- |
BraidPlot takes several options:
| In[5]:= |
Options[BraidPlot] |
| Out[5]= | {Mode -> Graphics, Images -> {0.gif, 1.gif, 2.gif, 3.gif, 4.gif}, HTMLOpts -> }
|
The Mode option to BraidPlot defaults to "Graphics", which produces output as above. An alternative is setting Mode -> "HTML", which produces an HTML <table> that can be readily inserted into HTML documents:
| In[6]:= |
BraidPlot[br, Mode -> "HTML"] |
| Out[6]= | <table cellspacing=0 cellpadding=0 border=0> <tr><td><img src=1.gif><img src=0.gif><img src=1.gif></td></tr> <tr><td><img src=2.gif><img src=3.gif><img src=2.gif></td></tr> <tr><td><img src=1.gif><img src=4.gif><img src=1.gif></td></tr> <tr><td><img src=2.gif><img src=3.gif><img src=2.gif></td></tr> <tr><td><img src=0.gif><img src=4.gif><img src=0.gif></td></tr> </table> |
The table produced contains an array of image inclusions that together draws the braid using 5 fundamental building blocks: a horizontal "unbraided" line (0.gif above), the upper and lower halves of an overcrossing (1.gif and 2.gif above) and the upper and lower halves of an underfcrossing (3.gif and 4.gif above).