Drawing with TubePlot
(For In[1] see Setup)
In[1]:= ?TubePlot
TubePlot[gamma, {t, t0, t1}, r, opts] plots the space curve gamma with the variable t running from t0 to t1, as a tube of radius r. The available options are TubeSubdivision, TubeFraming and TubePlotPrelude. All other options are passed on to Graphics3D. TubePlot[TorusKnot[m, n], opts] produces a tube plot of the (m,n) torus knot. |
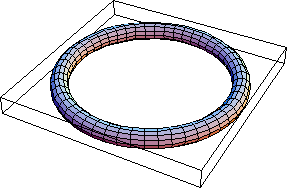
Thus here's a thin unknot:
| In[2]:= |
Show[TubePlot[{Cos[t], Sin[t], 0}, {t, 0, 2Pi}, 0.1]]
|
| |
| Out[2]= | -Graphics- |
In[3]:= ?TubeSubdivision
TubeSubdivision is an option for TubePlot. TubePlot[__, TubeSubdivision -> {l, m} draws the tube subdivided to l pieces lengthwise and m pieces around. The default is TubeSubdivision -> {50, 12}. |
In[4]:= ?TubeFraming
TubeFraming is an option for TubePlot. TubePlot[gamma, {t, __}, _, TubeFraming -> n] sets the framing of the tube (visible when TubeSubdivision -> {l, m} with small m) to be the vector n, which in itself may be a function of t. Thus TubeFraming -> {0,0,1} is "blackboard framing". TubeFraming -> Normal (default) uses the normal vector of the curve gamma. |
In[5]:= ?TubePlotPrelude
TubePlotPrelude is an option for TubePlot. Its value is passed to Graphics3D before the main part of the plot, allowing to set various graphics options. For example, TubePlotPrelude -> EdgeForm[{}] will suppress the drawing of edges between the polygons making up the tube. The default is TubePlotPrelude -> {}. |
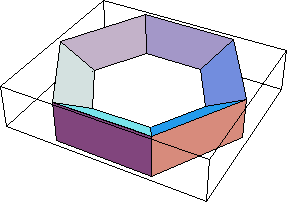
Here's the same unknot, made thicker and not as smooth:
| In[6]:= |
Show[TubePlot[
  {Cos[t], Sin[t], 0}, {t, 0, 2Pi}, 0.3, TubeSubdivision -> {6, 3}
]]
|
| |
| Out[6]= | -Graphics- |
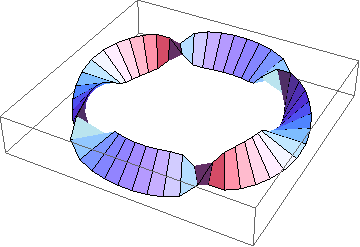
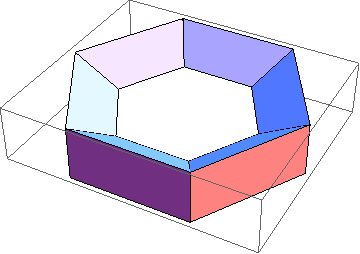
Let's play with the framing now:
| In[7]:= |
Show[TubePlot[
  {Cos[t], Sin[t], 0}, {t, 0, 2Pi}, 0.2,
  TubeSubdivision -> {50, 2},
  TubeFraming -> {Cos[2t]Cos[t], Cos[2t]Sin[t], Sin[3t]}
]]
|
| |
| Out[7]= | -Graphics- |
Here's an example that uses a prelude and passes options on to Graphics3D:
The last example serves as the basis for the definition of TubePlot[TorusKnot[m, n]]. Here's a final example:
| In[9]:= |
Show[TubePlot[TorusKnot[3, 5]]] |

| |
| Out[9]= | -Graphics- |
Standalone TubePlot
There may be some independent interest in the routine TubePlot, and hence it is available also as an independent package. Here it is: TubePlot.m.
