A Sample KnotTheory` Session
From Knot Atlas
Jump to navigationJump to search
Setup
The first step is to load KnotTheory` as in Setup:
In[1]:= << KnotTheory`
Loading KnotTheory` (version of September 14, 2005, 13:37:36)...
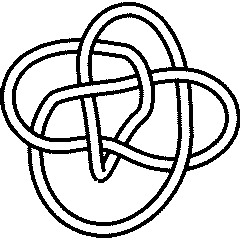 8_17 |
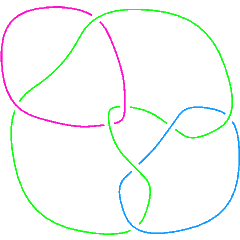
 K11a231 |
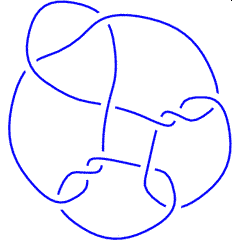
 L8n6 |
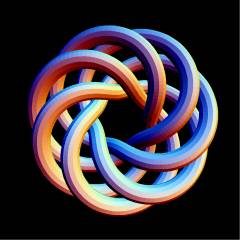 T(7,5) |
Let us now introduce the four star knots that will accompany us throughout this session:
In[2]:=
|
K = Knot[8, 17];
K11 = Knot[11, Alternating, 231];
L = Link[8, NonAlternating, 6];
TK = TorusKnot[7,5];
|
Presentations
In[3]:=
|
PD[K]
|
Out[3]=
|
PD[X[6, 2, 7, 1], X[14, 8, 15, 7], X[8, 3, 9, 4], X[2, 13, 3, 14],

  X[12, 5, 13, 6], X[4, 9, 5, 10], X[16, 12, 1, 11], X[10, 16, 11, 15]]
|
In[4]:=
|
{GaussCode[K], GaussCode[L]}
|
Out[4]=
|
{GaussCode[1, -4, 3, -6, 5, -1, 2, -3, 6, -8, 7, -5, 4, -2, 8, -7],

  GaussCode[{1, -7, 2, -8}, {-5, 4, -6, 3},

   {7, -1, -4, 5, 8, -2, -3, 6}]}
|
In[5]:=
|
DTCode[K]
|
Out[5]=
|
DTCode[6, 8, 12, 14, 4, 16, 2, 10]
|
In[6]:=
|
br = BR[K]
|
Out[6]=
|
BR[3, {-1, -1, 2, -1, 2, -1, 2, 2}]
|
In[7]:=
|
Show[BraidPlot[br]]
|

| |
Out[7]=
|
-Graphics-
|
In[8]:=
|
{First[br], Crossings[br], BraidIndex[K]}
|
Out[8]=
|
{3, 8, 3}
|